Project Description
The study was conducted in two phases. The first phase ran from July 1994 to October 1998 and included extensive analysis of the soils for the first three years. The second phase ran from May 1997 to October 1998 and focused on the role of straw and fertilizer in the remediation process.
Phase I
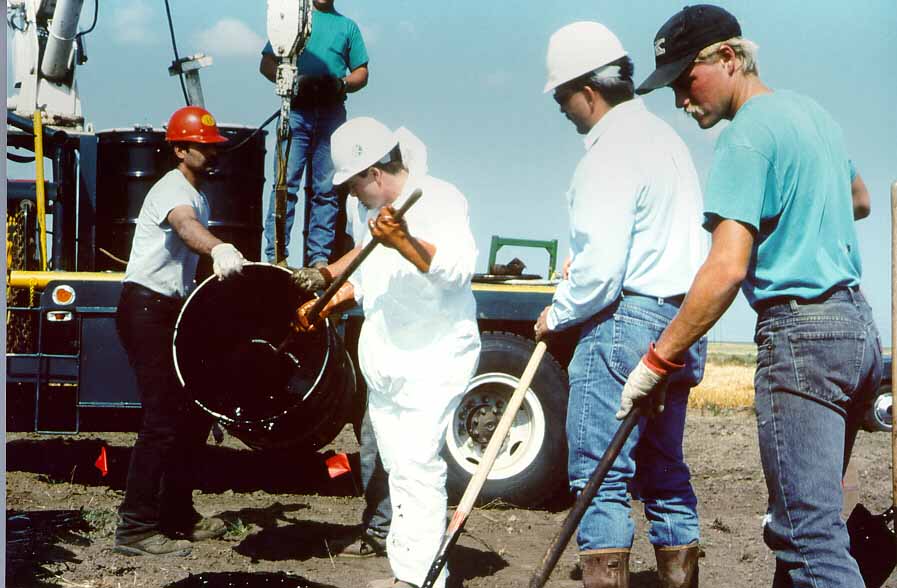
The first phase used a 20 ft by 50 ft test plot and a control plot of the same size. The soils at the test and control plots are classified as Williams-Bowbells silty: all normal very fine sandy loams, loams, silt loams, and silts. Both plots slope gently to the southeast. Eleven barrels of tank bottoms from the Fryburg Oil Field (near Medora, North Dakota; production from the Interlake, Madison, Red River, and Devonian formations) were spread over the test plot using hand tools (Figure 1). An analysis of the oil is presented in Figure 3. Because the tank bottoms consisted of 60% total petroleum hydrocarbons (TPH), the amount applied to the soil was 2600 lb or a loading rate of 6% TPH by weight to the top 6 inches of soil. The tank bottoms were then tilled into the soil running three times north and south and three times east and west over the entire plot (Figure 2). Both plots were tilled monthly for the duration of the study.
Soil samples of both the control and test plots were analyzed over the next three years to monitor total petroleum hydrocarbon (TPH), soil moisture, pH, conductivity, CEC, cations (Ca, Na, and Mg), anions (Cl, and sulfate), SAR, and fertility (nitrogen, potassium, phosphorus). These analyses are plotted on Figures 4, 5, and 6.
Nitrogen was added to this test plot at a rate of 100 lb/acre (2.3 lbs/1000 sq ft) to the plots over the course of the study, and these additions are noted on Figure 4.
One year after tank bottoms were spread (May 1995), both plots were planted in barley, spring wheat, lentils, and safflower. All crop plants grew well in the control plot. In the treated plot only the barley emerged, grew for about 1 month, and then turned yellow and died. Gypsum was added to the test plot at a rate of 100 lb/1000 sq ft. The crops in both plots were then plowed under.
The following year (May 1996) the test plot was given an application of nitrogen (6.9 lb/1000 sq ft of 34-0-0) and phosphorus (1.3 lb/1000 sq ft of 0-44-0) and both plots were planted in Logan barley, Amidon hard red spring wheat, Linton flax, Trapper peas, and safflower variety 6011. Very little growth appeared in the test plot, while the crops in the control plot grew at a normal growth rate.
It was observed that soil in the test plot contained water puddles several days after a rain, while during the same time soil in the control plot had absorbed the rain and dried out. The soil beneath the puddles was dry. Using a clear plastic cup, it was further demonstrated that the soil was not absorbing water. It appeared that this hydrophobic property of the oil-contaminated soil was a critical factor in its inability to produce crop growth. In July 1996, one gallon of surfactant (NoBurn, 89.9% Sarsaponin-Schidigera extract) was obtained to determine if the soil could be made to absorb water after application of the surfactant. Before the application of NoBurn to the test plot, two simple lab trials were performed. A sample of the soil from the test plot was placed into a foam cup; NoBurn was applied and thoroughly mixed into the soil. When water was added to the sample, it was absorbed. Another sample of soil was obtained from the test plot and placed in a plastic plate. NoBurn and seeds of wheat, barley, peas and safflower were added; the seeds germinated and the plants grew well. This suggested that seed germination and plant growth was not inhibited by the oil, but rather by the lack of water in the soil. However, when NoBurn was applied to small areas within the test plot, it did not appear to condition the soil enough to support plant growth.
In October 1996, a truckload of manure (4000 lb/1000 sq ft) was applied to the southern half of the treated plot along with pelleted sulfur (200 lb/1000 sq ft), gypsum (200 lb/1000 sq ft), nitrogen (8 lb/1000 sq ft of 34-0-0) and phosphorus (2 lb/1000 sq ft of 18-46-0). In May 1997 and 1998 both plots were planted in hard red spring wheat. The manured half of the test plot grew crops (yielding 35.7 bushels/acre in the test plot for the 1997 growing season) as did the control crop, but the unmanured half of the test plot had no growth in either year (Figure 7).
Phase II
In October 1996, the project was scaled-down and continued with two new test plots plus a new control plot. These plots were all 50 ft by 50 ft in size. Three barrels of tank bottoms from a production site near Keene, North Dakota were spread on the two test plots. An analysis of the oil is presented in Figure 8. Because the tank bottoms consisted of 77% TPH, we may estimate an application rate of 0.6%.
Because the soil in the test plot in Phase I was observed to shed water, it was proposed that straw could be added to the Phase II plots to increase water infiltration. One-half of each of the two Phase II test plots (plot #1 and plot #2) and the Phase II control plot were spread with straw at a rate of 45 lb/1000 sq ft. Test plot #1 also received an application of fertilizer (34-0-0 at 40 lb/1000 sq ft and 18-46-0 at 80 lb/1000 sq ft). Test plot #2 also received an application of fertilizer (34-0-0 at 160 lb/1000 sq ft and 18-46-0 at 80 lb/1000 sq ft. The control plot received no fertilizer. The test plots were analyzed in June and October 1997 and the results are tabulated in Figure 9.
All of the plots were planted in May 1997 (before the tank bottoms were applied) with hard red spring wheat, variety 'Keene'. Crops were successfully grown; the yield of each area of the plots is listed in Figure 10.
Samples were analyzed for total petroleum hydrocarbons at the beginning of Phase II of the project (May 1997, before tank bottoms were spread) and the following spring (March 1998). These results are tabulated in Figure 11.